

HTML Report
Generate a self-contained, interactive HTML report of your attack surface scan results.
Write the scan results as one interactive HTML file. It has no external dependencies, so it opens offline and is easy to share. Color is used only where it means something: each HTTP method and each finding severity has its own.
Basic Usage
noir scan . -f html -o report.html
Preview
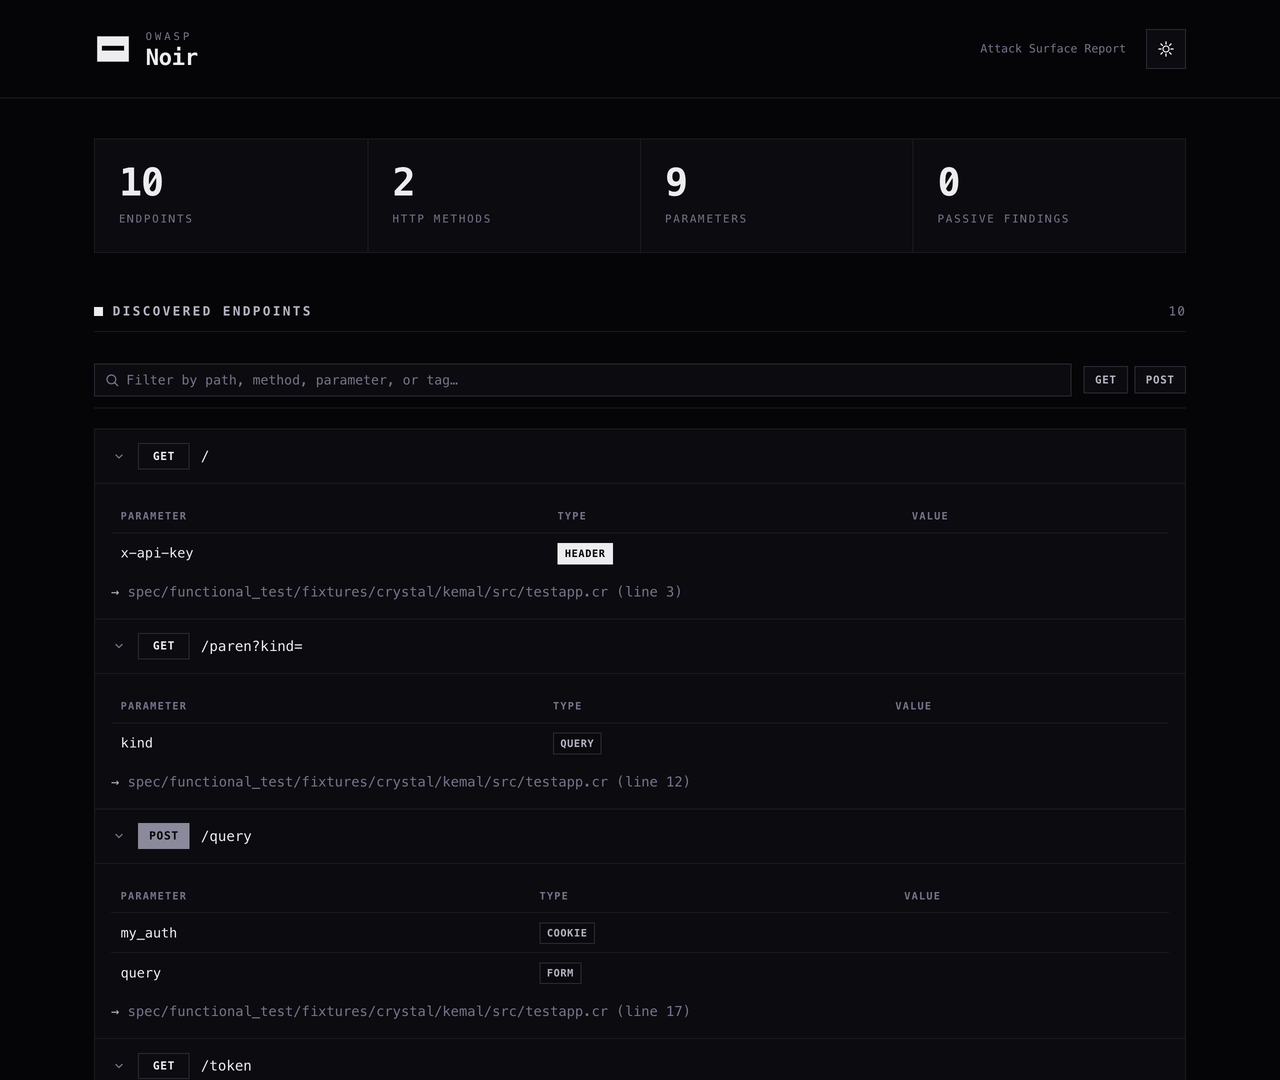
The screenshots below are a real report, generated from Noir's Kemal test fixture. You can reproduce it from a checkout of the repository:
noir scan -b spec/functional_test/fixtures/crystal/kemal -f html -o report.html
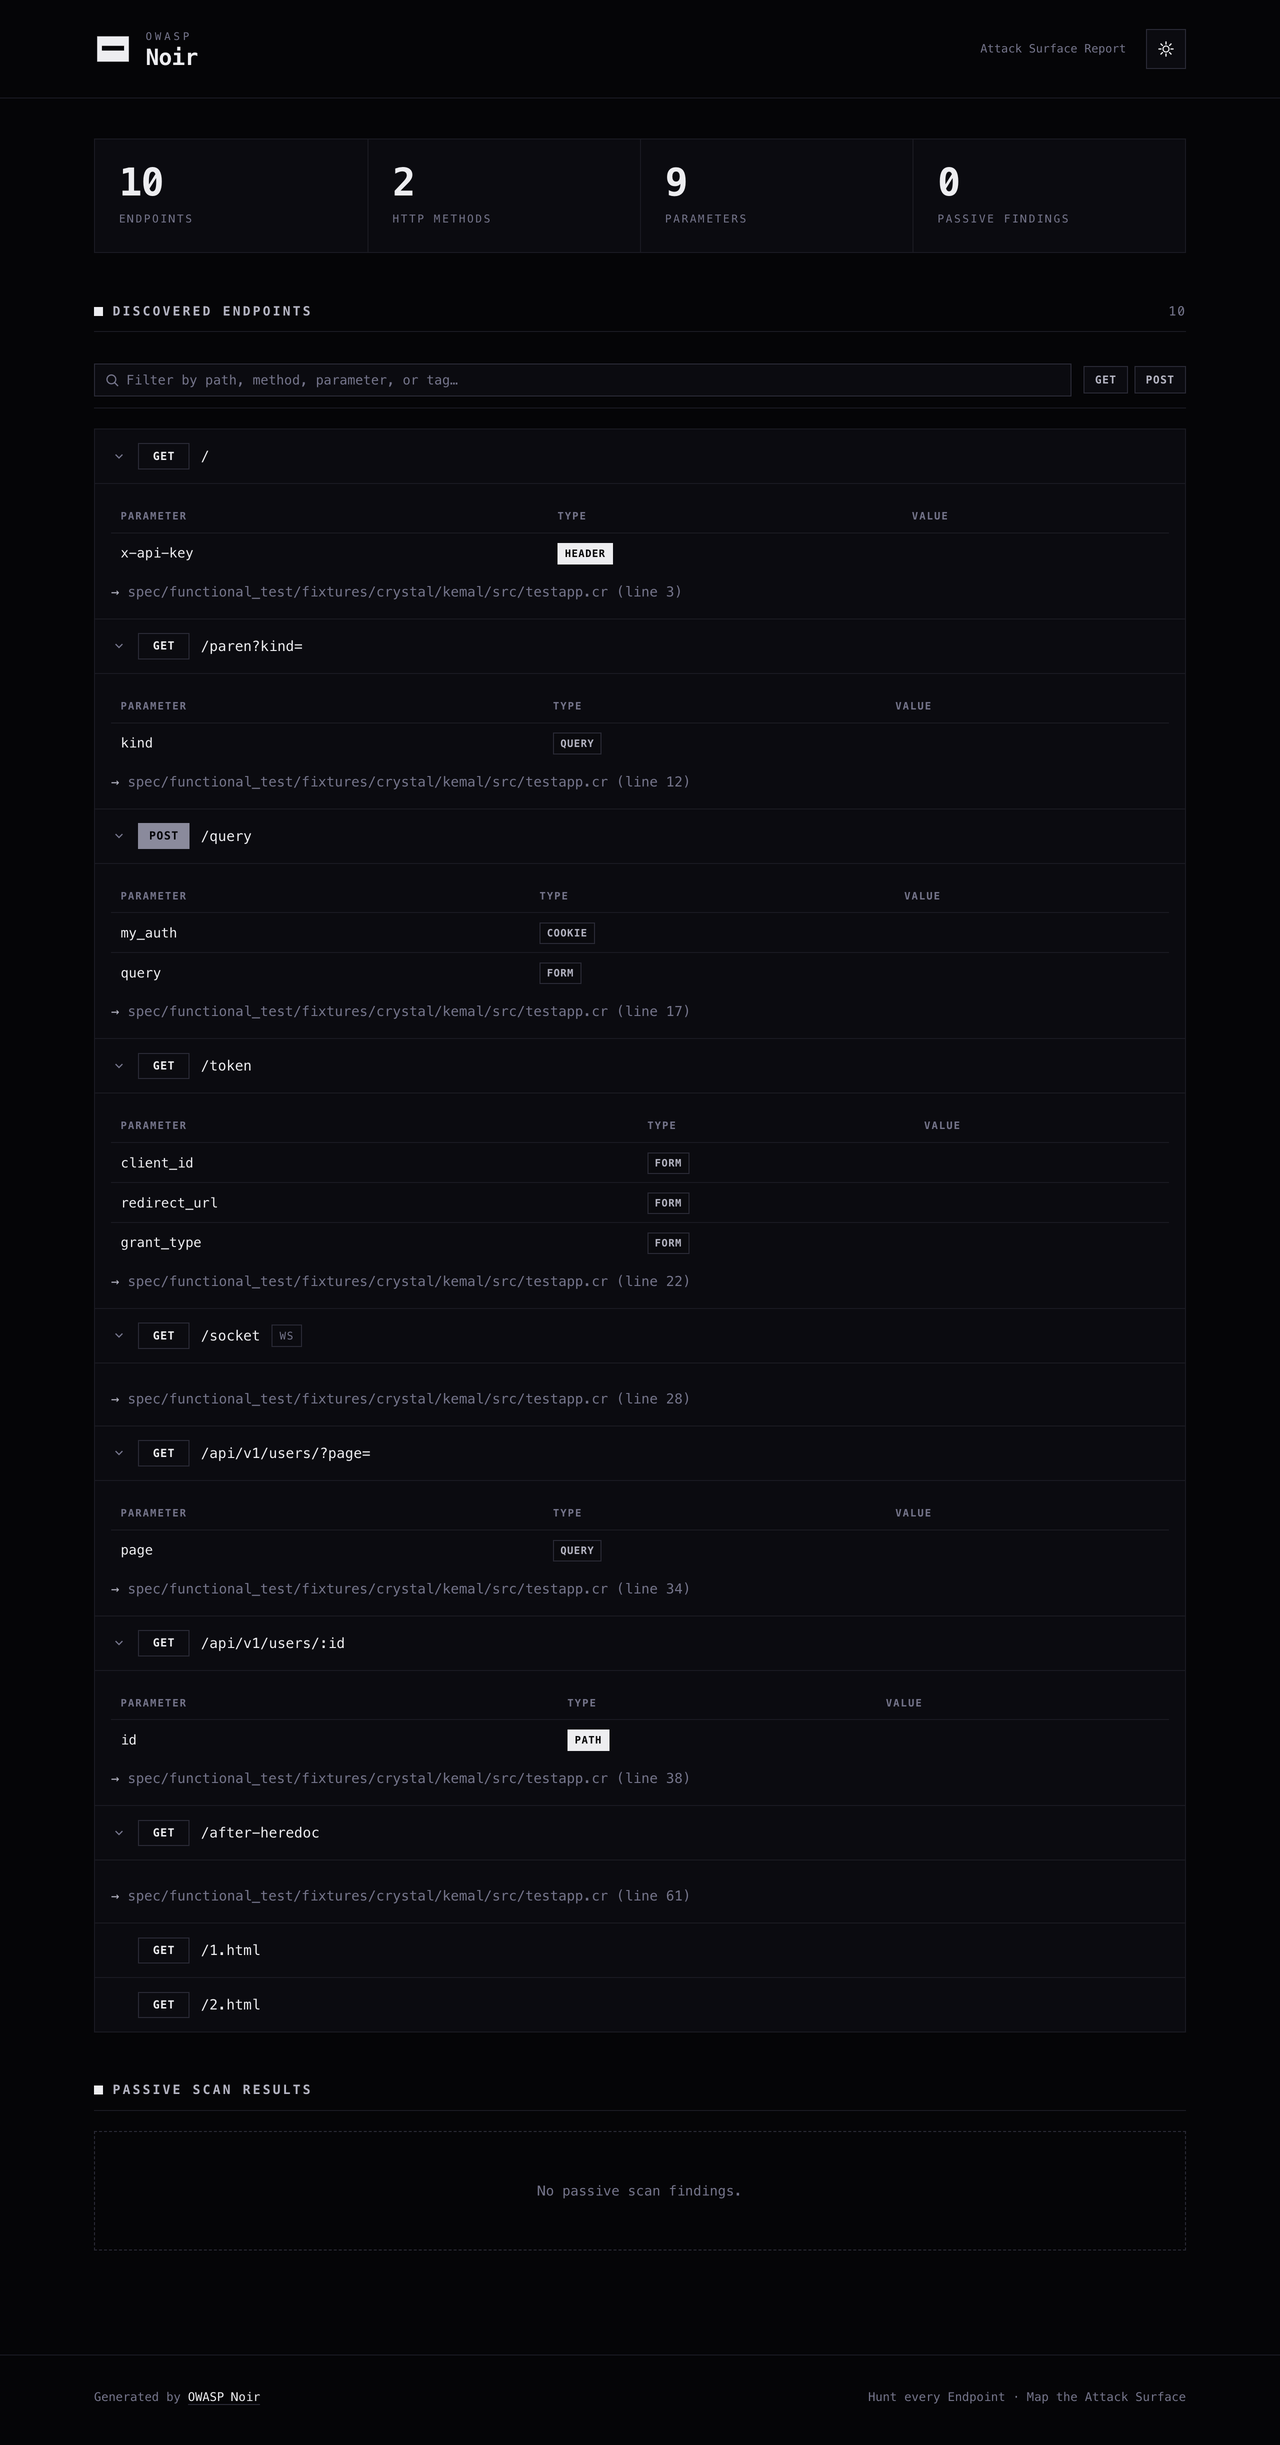
The report also has a dark theme. Switch it with the control in the top-right corner. Your choice is saved in localStorage, and on first open the report follows the OS prefers-color-scheme setting.
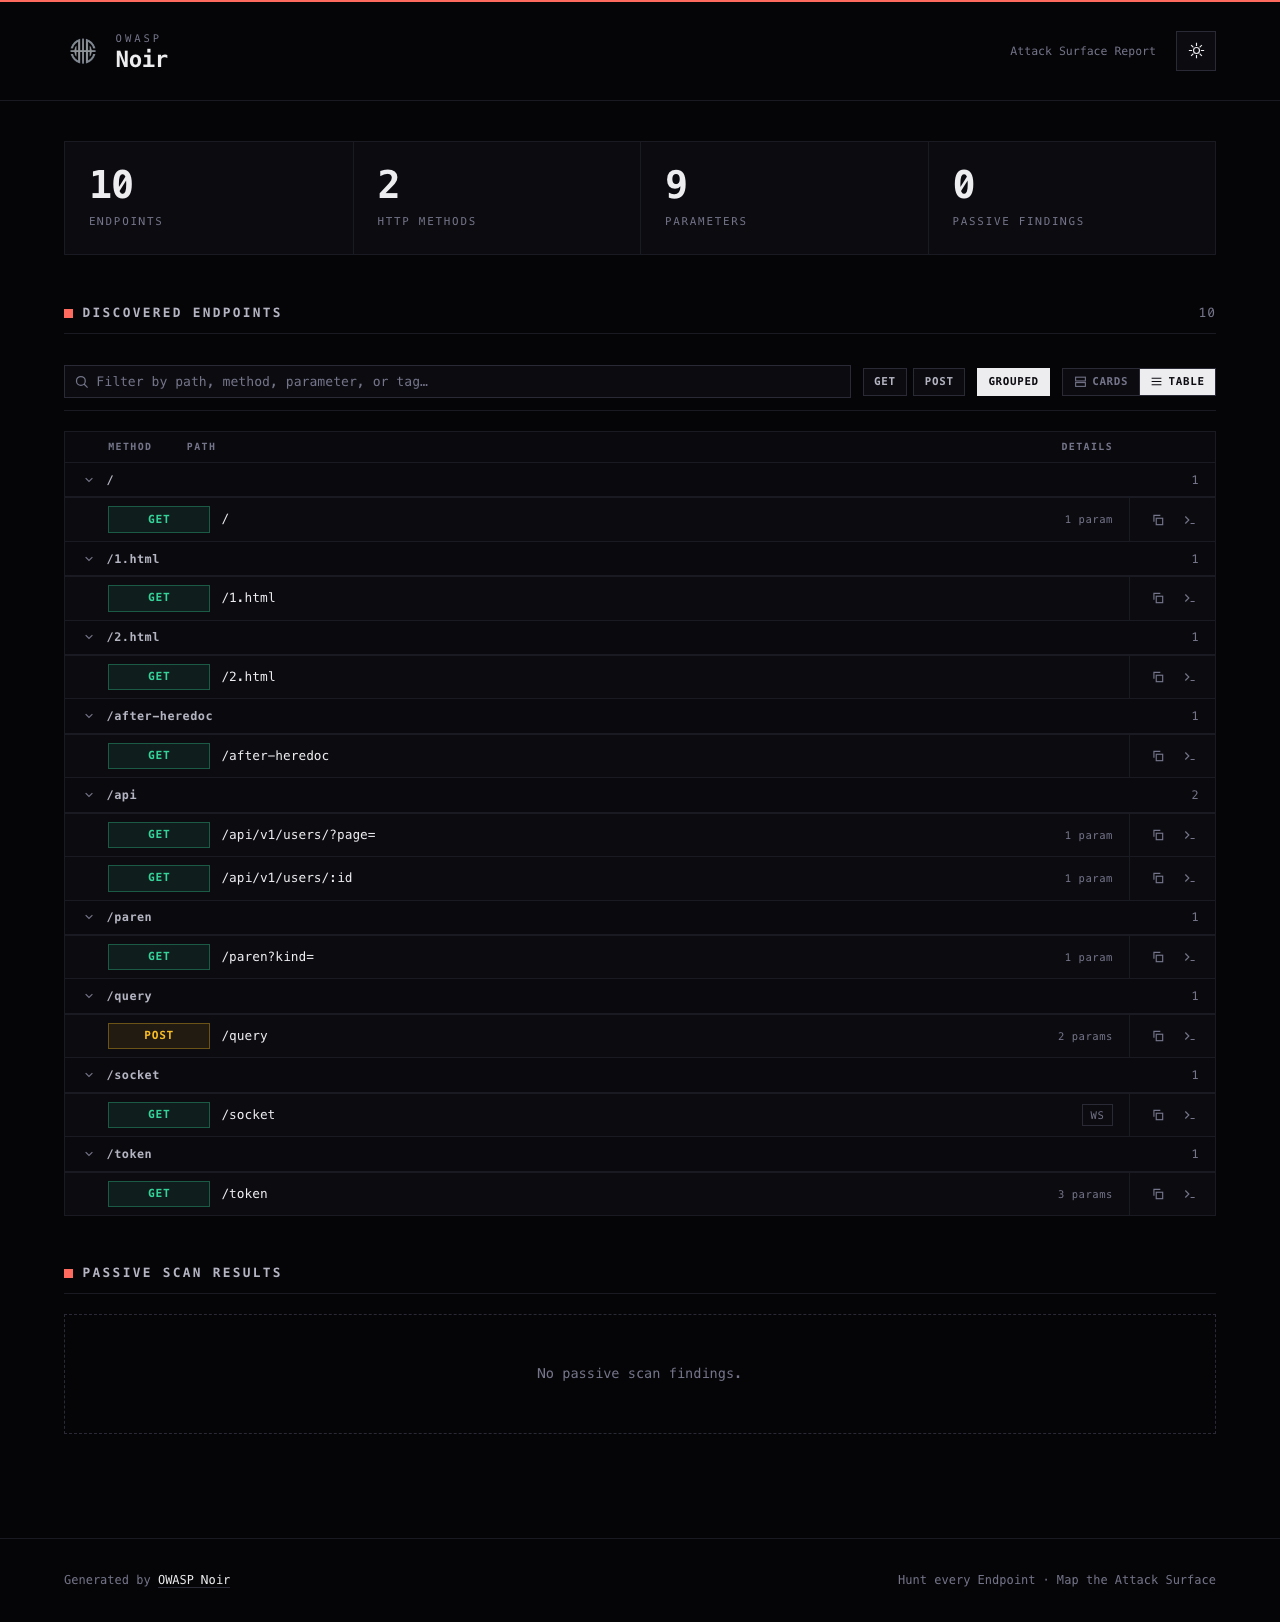
For large scans, switch to the table view with the Cards / Table control. The same endpoints are shown as compact rows, which is quicker to read through when there are hundreds of paths.
What's in the report
- Summary: counts of endpoints, HTTP methods, parameters, and passive scan findings.
- Endpoints: one collapsible card per endpoint, with a colored method badge (GET emerald, POST amber, PUT blue, PATCH violet, DELETE red) and a protocol badge for non-HTTP endpoints such as WebSockets.
- Path groups: endpoints are grouped by their first path segment (or host for absolute URLs), with collapsible group headers and per-group counts.
- Parameters: a table per endpoint listing each parameter, its type (query, form, json, header, cookie, path, file, xml, and related), and value.
- Passive scan results: with
-P, findings are shown with descriptions, colored severity badges, and the matched code snippet. - Source locations: the file path and line number where each endpoint was defined.
Interactive features
All of this works from the HTML file alone, with no server or network access.
- Light / dark theme toggle, saved across visits.
- Cards / table view toggle, also saved across visits.
- Path grouping: collapse groups you have already reviewed, or flatten the list with the Grouped toggle. Group counts update as you filter.
- Search: filter endpoints by path, method, parameter, or tag, with a "shown / total" count.
- Method and severity filter chips for the endpoint and passive-finding lists.
- Copy buttons on every endpoint: copy the URL, or a curl command built from the endpoint's method, parameters, headers, and cookies.
- Printing opens every card and group and hides the controls. The report also honors
prefers-reduced-motion.
Customizing the Template
You can supply your own template, for example to add company branding.
Template Location
Noir looks for report-template.html in your configuration directory:
- Linux/macOS:
~/.config/noir/report-template.html - Windows:
%APPDATA%\noir\report-template.html - If
NOIR_HOMEis set:$NOIR_HOME/report-template.html
If found, Noir uses it instead of the built-in default.
Placeholders
Templates use placeholders that Noir replaces with generated content:
| Placeholder | Description |
|---|---|
<%= noir_head %> |
The contents of the <head> tag, including default CSS, metadata, and the pre-paint theme initializer. |
<%= noir_header %> |
The header section containing the title, brand mark, and theme toggle. |
<%= noir_summary %> |
The summary dashboard (cards showing counts). |
<%= noir_endpoints %> |
The main section listing all discovered endpoints, including the search box, filter chips, view toggle, and path groups. |
<%= noir_passive_scans %> |
The section listing passive scan results. |
<%= noir_footer %> |
The footer section. |
<%= noir_scripts %> |
The interactivity scripts (theme toggle, collapsible cards and groups, search, filters, view switching, and copy buttons). |
Example Template
A minimal template that adds a company header and reuses Noir's styles, sections, and scripts through the placeholders.
<!DOCTYPE html>
<html lang="en">
<head>
    <!-- Include default styles and the pre-paint theme initializer -->
    <%= noir_head %>
    <style>
        /* Add custom overrides */
        body { background-color: #f0f2f5; }
        .company-header { padding: 20px; text-align: center; background: #333; color: #fff; }
    </style>
</head>
<body>
    <div class="company-header">
        <h1>My Company Security Report</h1>
    </div>

    <!-- Original Header -->
    <%= noir_header %>

    <main class="container">
        <!-- Summary Section -->
        <%= noir_summary %>

        <h2>Detailed Findings</h2>

        <!-- Endpoints List -->
        <%= noir_endpoints %>

        <!-- Passive Scan Results -->
        <%= noir_passive_scans %>
    </main>

    <%= noir_footer %>

    <!-- Interactivity: theme toggle, collapsible cards, search, filters -->
    <%= noir_scripts %>
</body>
</html>
Save it as ~/.config/noir/report-template.html and every later -f html run uses it.